A new branching scheme
Posted May 29, 2013 by dnschnurLast week’s release of 0.8.1 was Flot’s first-ever point-release. One of the reasons why we haven’t had them in the past is because our branching scheme didn’t support it.
Before 0.8, every pull request and fix was merged straight into master, making it always the latest version of the library. This was easy to understand, but prevented us from releasing minor fixes separate from major changes that we knew were incomplete or still needed more testing.
 </img>
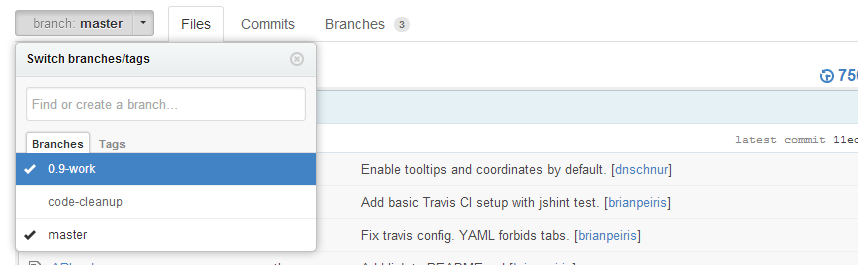
You may have already noticed that after the release of 0.8 we added a couple of new branches: 0.9-work and code-cleanup. Now master represents the stable release - currently 0.8.2 - while new features and major releases are given separate branches. Feature branches are merged into the next major-release branch on completion, and when the release is ready it is merged into master.
All this time, we can continue merging minor fixes into master. This lets us ship point-releases to get those changes out to you faster, so you don’t have to wait until the next major-release to use them safely in production.
After every point-release we merge back into the next major-release branch, to keep it up-to-date as work continues.
This is great for users, but it does mean that those of you contributing pull requests need to do a little more to ensure that you’re working from the correct branch. If your contribution is anything beyond a bug fix - if it adds a feature or changes the API in any way - then you should base against the 0.9-work branch.
As always, please try to follow Flot’s contribution guidelines. We will soon begin requiring that new code pass our automated JSHint before we’ll merge it. It’s just a good idea in general; it makes the merge easy for us so we have more time to work on new features for you.
Flot 0.8.1 released
Posted May 22, 2013 by dnschnurWe’ve released Flot 0.8.1, with patches for regressions introduced in 0.8 and other fixes that either couldn’t make it into 0.8 or were reported later. You can download 0.8.1 here.
Important Bug Fixes in 0.8.1
Axis labels: Fixed several axis labeling issues, including regressions in 0.8 that changed the way dates were aligned, caused duplicate axis labels to disappear, and prevented label text from wrapping.
Pie plugin: Resolved a regression in 0.8 that broke pie charts if their data was provided in [[x, y]] format.
jQuery compatibility: Worked around a regression in 0.8 that broke compatibility with jQuery versions earlier than 1.7.
Axis scaling: Fixed a bug in the implementation of the series ‘zero’ option that caused it to be ignored for series with nulls in their data.
See the NEWS file for a complete listing of changes made and bugs fixed.
Acknowledgments
We’d like to give special thanks to Brian Peiris, Daniel Rothig, Daniel Shapiro, goorpy, Lee Willis, Marcelo Jorge Vieira, Mark Raymond, Michal Zglinski, Nicolas Morel, Paolo Valleri, sabregreen, Tom Sheppard, and vird for contributing fixes or reporting issues fixed in this release.
Flot 0.8 is live!
Posted April 10, 2013 by dnschnurWe’re excited to announce the release of Flot 0.8! Two years in the making, it includes more than a hundred new features and bug fixes from more than fifty contributors. Download the new version and enjoy!
What’s New in 0.8?
Time series improvements: Support for time series has been moved into a plugin, jquery.flot.time.js, and a new axis option “timezone” controls the time zone in which dates are displayed.
Canvas text: A new plugin, jquery.flot.canvas.js, renders axis tick labels directly to the canvas, rather than using HTML elements, making it much easier to save entire plots as images.
Plotting categories: The new categories plugin makes it easy to plot data that is grouped into text categories rather than numeric axis values.
Plotting error bars: The new error bars plugin can be used to show standard deviation and other useful statistical properties.
Support for high-resolution displays: Flot now looks even crisper on the high-density displays found in many new phones, tablets, and laptops.
Lots of bug fixes: We’ve fixed over a hundred bugs, resolving long-standing issues with the pie plugin and cross-browser compatibility, among many others.
Many other enhancements: We’ve added everything from improved control over the grid’s appearance to legend sorting to thresholding improvements.
See the NEWS file for a complete listing of changes made and bugs fixed.
Acknowledgments
Flot 0.8 has received more community contributions than any previous version. We’d like to give special thanks to the YCharts team for sponsoring the canvas text project, and to aaa707, Adam Mckaig, alanayoub, Alexander Blunck, Alexander O. Anisimov, Anthony Ryan, Ara Anjargolian, Arnaud Bellec, Arpan, Bevan, Brian Peiris, chage, Christopher Lambert, Clemens Stolle, dalton, Daniel Shapiro, Eddie Kay, Eric Wendelin, gcruxifix, hizhengfu, Hongli Lai, Ivan Novikov, James Ward, Jamie Hamel-Smith, Julien Thomas, Jürgen Marsch, kaarlenkaski, Karl Swedberg, Knut Forkalsrud, Lasse Dahl Ebert, Lau Bech Lauritzen, maimairel, martinqt, Michael Mayer, Nate Abele, Nick Campbell, Olivier Guerriat, Ralph Holzmann, risicle, Rui Pereira, Ruth Linehan, Sean Jordan, Sergiy Borodych, Simon Strandgaard, Shad Downey, Shane Reustle, Steve Robinson, thecountofzero, Tom Cleaveland, Yael Elmatad, and the many others who reported bugs, suggested features, and answered questions on the forums!
Announcing Flot 0.8 beta
Posted March 6, 2013 by dnschnurWe’re excited to announce that Flot 0.8 has entered beta! It has been almost two full years since the release of version 0.7, and we’re very happy to see all the new stuff that we’ve been working on finally move towards a major release!
To the Flot community: thank you so very much for your support and the enormous number of bug reports, feature suggestions, and pull requests that you’ve contributed towards this release.
Now grab a copy and start testing it!
What’s New?
Time series improvements: Support for time series has been moved into a plugin, jquery.flot.time.js, and a new axis option “timezone” can be used to control the time zone in which the dates are displayed.
Canvas text: A new plugin, jquery.flot.canvas.js, allows axis tick labels to be rendered directly to the canvas, rather than using HTML elements, making it much easier to save entire plots as images.
Plotting categories: The new categories plugin makes it easy to plot data that is grouped into text categories rather than numeric axis values.
Plotting error bars: The new error bars plugin can be used to show standard deviation and other useful statistical properties.
Support for high-resolution displays: Flot now looks even crisper on the high-density displays found in many new phones, tablets, and laptops.
Tons of bug fixes: We’ve fixed over a hundred bugs, resolving long-standing issues with the pie plugin and cross-browser compatibility, among many others.
Lots of enhancements: We’ve added and merged a huge number of enhancements, covering everything from improved control over the grid’s appearance to legend sorting to thresholding improvements.
See the NEWS file for a complete listing of changes made and bugs fixed.
What to Test
The long development cycle for this release means that many of its changes are already quite stable, but we still need your help to ensure that the 0.8 final release is as solid as possible.
We’d especially appreciate testing of canvas-text across a wide-range of browsers, platforms, and font options. Another great testing target is the new time-series plugin, including timezones and date/time formatting options.
The long road to canvas text
Posted February 24, 2013 by dnschnurAfter several delays, canvas text support in 0.8 is finally nearing completion!
For those of you who haven’t been following along, Flot has historically used HTML divs to render axis labels and other text. One of the major projects for the 0.8 release, sponsored by YCharts, was a switch to rendering text directly onto the canvas. This offered better performance and made it possible to save an entire plot (minus the legend) to an image.
But it turned out that many users had come to rely on HTML text, and it has advantages of its own, including the ability to embed mark-up, better styling, straightforward interactivity via jQuery events, and more reliable metrics and render quality.
So we needed a way to make both sides happy. Our solution was to revert to HTML text as the default, while making it very simple to re-render the plot with canvas text at any time. The implementation took a while to evolve - see pull request #935 - but has stabilized enough that we’ll be able to merge it into master very soon.
To enable drawing to canvas, one need only include the jquery.flot.canvas.js plugin, then enable it like this:
$.plot("#placeholder", series, {
	canvas: true
})
This works even if you’re using CSS to style your text; the plugin will create a dummy element and extract its text styles. Our goal is for the transition to be seamless; you should be able to create an interactive plot using HTML text, then toggle canvas rendering to save it as an image, and not see a difference. This is demonstrated in the image below:
 </img>
The only difference is that canvas text is shifted down by a pixel, and even that should be resolved in time for the 0.8 release.
This is all backed by our new text API, which will make it easy for us to add features like axis labels to the core in subsequent releases. It’s currently for internal use only, but we plan to open it to plugins as soon as possible.
Looking further ahead, the canvas plugin isn’t restricted to axis labels; adding the ability to render the legend to canvas is the next logical step.